Click here for the
Legacy PeanutBase
site.
PeanutBase
Genetic and genomic data to enable more rapid crop improvement in peanut.
Home
Species
hypogaea (peanut: cultivated tetraploid)
duranensis wild: diploid progenitor of A genome
ipaensis wild: diploid progenitor of B genome
cardenasii wild: diploid
stenosperma wild: diploid
Tools
Data Store
DSCensor
ArachisMine
The Peanut Genome
Browse
A. duranensis
Browse
A. ipaensis
Gene Expression Resources
Legumebot
Marker-Assisted Selection
NIFA PCCGP Project
Gene Search Tool
Trait Search Tool
BLAST
Funnotate
ArachisPheno
GCViT
Gene Family Search
Genome Context Viewer
Germplasm
Gigwa
JBrowse
ZZBrowse
Download
Community
External
Contact
Help
Home
SPECIES(TAXA)
hypogaea (peanut: cultivated tetraploid)
duranensis wild: diploid progenitor of A genome
ipaensis wild: diploid progenitor of B genome
cardenasii wild: diploid
stenosperma wild: diploid
Tools
Data Store
DSCensor
ArachisMine
The Peanut Genome
Browse
A. duranensis
Browse
A. ipaensis
Gene Expression Resources
Legumebot
Marker-Assisted Selection
NIFA PCCGP Project
Gene Search Tool
Trait Search Tool
BLAST
Funnotate
ArachisPheno
GCViT
Gene Family Search
Genome Context Viewer
Germplasm
Gigwa
JBrowse
ZZBrowse
Download
Community
Contact
Help
Home
Taxa
Arachis (peanut: domesticated and wild)
OTHERS (Many special-focus species and collections)
Tools
Data Store
DSCensor
ArachisMine
The Peanut Genome
Browse
A. duranensis
Browse
A. ipaensis
Gene Expression Resources
Legumebot
Marker-Assisted Selection
NIFA PCCGP Project
Gene Search Tool
Trait Search Tool
BLAST
Funnotate
ArachisPheno
GCViT
Gene Family Search
Genome Context Viewer
Germplasm
Gigwa
JBrowse
ZZBrowse
Download
Community
Contact
Help
Twitter
Newsletter
GitHub
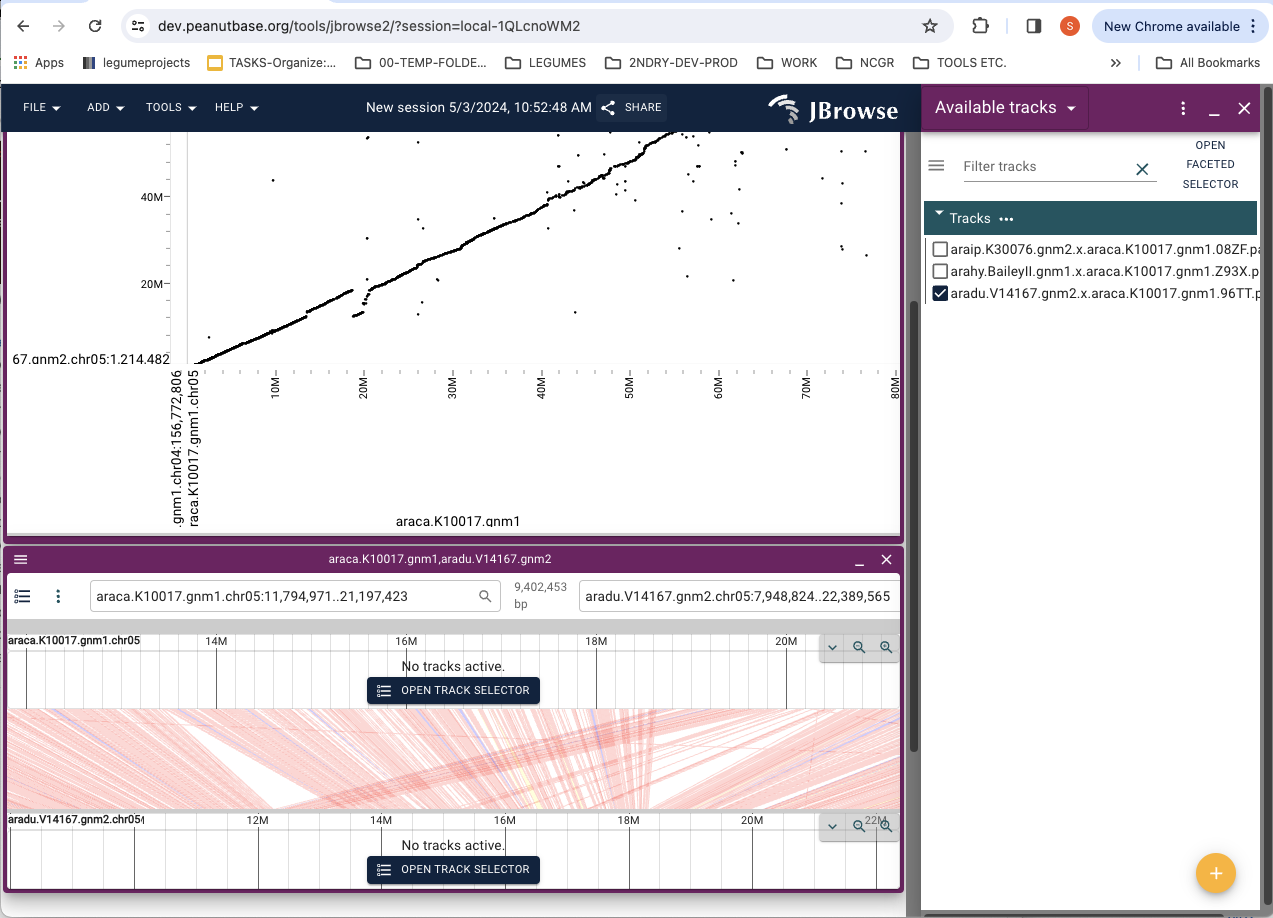
JBrowse2: Genome structure comparison between two genomes
Comparison between duranensis and cardenasii genomes
Start a new session
Select Dotplot view and launch.
At Select assemblies for dotplot view.
Ardu.gnm2 and Araca.gnm1. Open.
At matrix view
Zoom until the two needed Chrs are visible.
Select the entire rectangle(click-drag) representing the two Chrs for comparison.
Select zoom in. An empty chart appears.
Click tract selector(☰)
In the “Available tracks panel” (right) choose aradu.gnm2-x-araca.gnm1.
Dotplot of the selected region or Chr appears.
Next: (Optional)if need to add synteny view of the region
Select a region from dotplot (click-drag).
Select open linear synteny viewi from popup options.
A new view window appears below with synteny view.